From Cron Job to Self-Healing Pipeline, what I learnt in my first year building EO data pipelines
Table of Contents
When my colleague Felix introduced me to the FOSS4G conferences and mentioned FOSS4G-Europe in Timișoara, I spent a bit of time brainstorming about what would be an interesting talk, and I thought that a good candidate could be to share what I learnt this year when building Earth Observation data pipelines (see my other post on it)!
I started working with data pipeline back in the days of my PhD (2010-2013). For my first scientific article, I built a consolidated database of upper ocean temperature measurements in order to quantify and understand the seasonal variability of the upper ocean heat content in the Mediterranean Sea. The main job was to merge thirteen separate hydrographic databases into one usable climatology: more than 140,000 quality-controlled individual ocean profiles, spanning 44 years of measurements. It was published in Houpert et al. 2015, Progress in Oceanography 132, 333–352 (if you are really interested by the details you can download it from here) . At that time the “data-pipeline” was stitched together by hand with linux cron jobs calling MATLAB scripts…. that I had to re-run myself whenever something looked off 😢 . I made It work, but it was very fragile, and needed someone constantly watching over it!
When I started working on data pipelines at Development Seed at the end of last year, I was not familiar with the tooling but I had a good understanding of the problems we were trying to solve. I was relatively new to Kubernetes (I never used it in prod environment, only tinkering with it on my homelab) and I never used Argo Workflows before. But to my surprise, it went faster than I expected, mostly because I was already familiar with the concepts and I just had to adapt to the new tool. I still remember where I got a bit stuck during my learning journey, which give me the idea of the talk I gave at FOSS4G and its companion repo co-created with Claude, argo-stac-eo-pipeline .
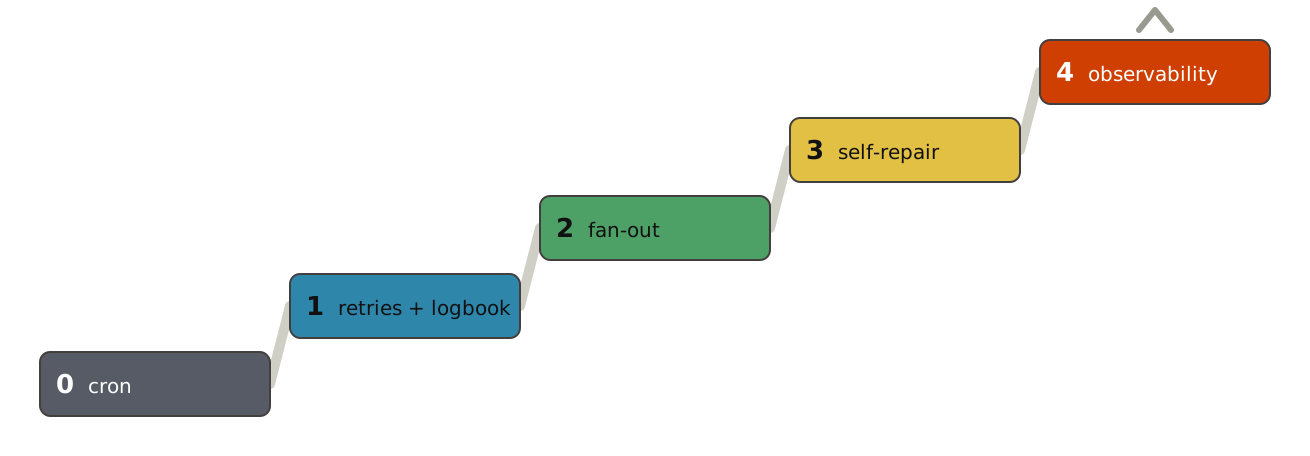
To structure the talk, I placed the setups I had used or built over the years on a small maturity ladder with different rungs. Rung 0 is the most basic step, the crontab line I started with during my PhD. Rung 4, the last one presented in the talk, represents a pipeline that repairs itself and tells me every morning what it did. Each rung takes a bit more of the babysitting work off my hands. In the companion repo each rung is a stage (stages/00-cron, stages/01-argo-retries …), which is why the demo commands below are make demo STAGE=01, STAGE=02 and so on.
Deep-dive into the demo #
All the demo is built so it can run on a laptop. Once the companion repo is cloned, you can just run make check; make up to spin a small kind cluster with MinIO for object storage, pgSTAC and a STAC API for the catalog, stac-browser to look at it, and Argo Workflows to run everything.
It ingests synthetic Earth-observation data across two STAC collections, synthetic-aurora-veil and synthetic-tidal-glass. None of it is a real satellite data, I wanted to keep that lightweight and put the focus on the data ingestion problems instead: daily acquisitions, occasional gaps, a backlog that needs backfilling.
The same docker image runs at every rung: eo-ingest:dev. It never changes from rung 0 to rung 4, what changes instead is what wraps it.
Rung 0: the cron job #
This is where I started when I built my first data pipeline during my PhD, a crontab line starting a shell script regularly with a log file which store the output of the script.
# trimmed from stages/00-cron/crontab
0 3 * * *  .../stages/00-cron/run.sh >> /tmp/eo-rung0.log 2>&1
The demo repo reproduces this situation with a single script. This is the only rung you run by hand (and the only one that works without the cluster):
./stages/00-cron/run.sh # ingest the default day
If we go into more details, the script simply starts a throwaway MinIO in docker, so there is a local S3 to write into, and then runs the same eo-ingest:dev image against it.
In some cases, this simple set up may be enough to get the job done, but I remember that when I was in academia I was spending a lot of time “babysitting” my pipelines (checking the outputs in the morning or re-running things by hand whenever a number looked wrong, or a network issue broke the pipeline) …
Rung 1: retries and a first logbook #
The first step towards removing this babysitting work is to move the crontab line into into Argo Workflows. The ingest script itself does not change at all, but we add two things in the orchestration around it:
- a retry policy, so I am no longer the one re-running things when the pipeline fail, and
- a STAC catalog acting as a logbook of what has landed, so there is finally a place where to find processed data (and their metadata).
# trimmed from stages/01-argo-retries/workflows/ingest.yaml
- name: ingest
  retryStrategy: {limit: "2", retryPolicy: Always}   # retry up to twice, on any failure
  container:
    image: eo-ingest:dev
    command: ["python", "-m", "eo_ingest.ingest"]
    env:
      - {name: FAIL_ONCE, value: "1"}
      - {name: STAC_URL, value: http://stac-api}
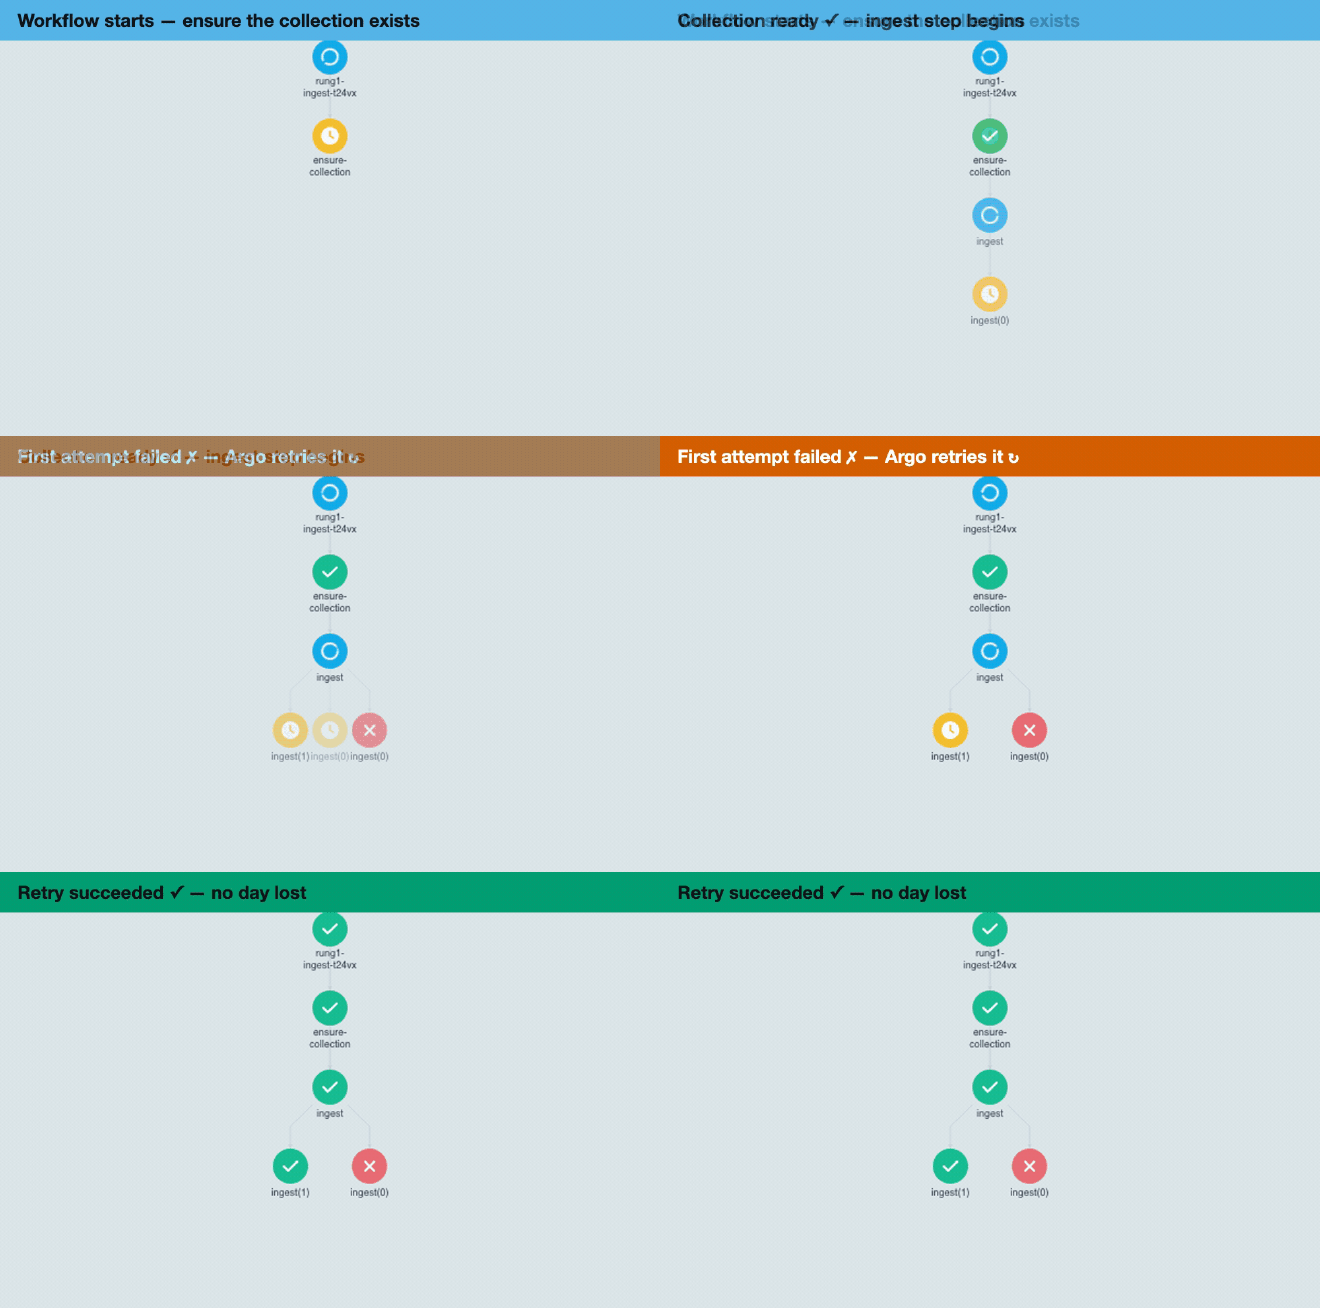
If we go into more details of the code block above, the FAIL_ONCE variable exist just for the demo: it creates the first fail attempt on purpose to simulate the kind of transient failure I used to fix by hand (a network issue, an upstream service having a bad moment …). Argo then notices the failure, starts a fresh pod, and the second attempt succeeds: in the Argo UI you can watch ingest(0) fail and ingest(1) succeed, and the day is recovered without anyone touching a keyboard. You can see it by yourself by running these commands:
make ui              # 1st terminal — open the Argo UI and leave it running
make demo STAGE=01   # 2nd terminal — submit rung 1, watch it fail once then succeed
make browse          # afterwards — the ingested item now appears in the catalog
The CronWorkflow that schedules this processing is very similar to the crontab line it replaces:
# trimmed from stages/01-argo-retries/cronworkflow.yaml
spec:
  schedule: "0 3 * * *"     # 03:00 daily — the same time the rung-0 crontab fired
  concurrencyPolicy: Forbid
  workflowSpec: { ... }     # the workflow above, unchanged
Now all the changes are wrapped around the original code in two small YAML files.
I think this is the rung that bring most values and saves the most human time on a real project!
Rung 2: fanning out the backfill #
Retries protect a single run, but at some point we want to “scale things up” especially when working on backfilling historical data. Rung 2 keeps exactly the same ingest step and runs it across a whole time window instead of one day at a time.
# trimmed from stages/02-fanout/workflows/backfill.yaml
spec:
  parallelism: 10          # at most 10 ingests run at the same time
  templates:
    - name: main
      dag:
        tasks:
          - name: backfill
            template: ingest-day
            arguments:
              parameters: [{name: day, value: "{{item}}"}]
            withItems: ["2026-03-01", "2026-03-02", "…", "2026-03-30"]
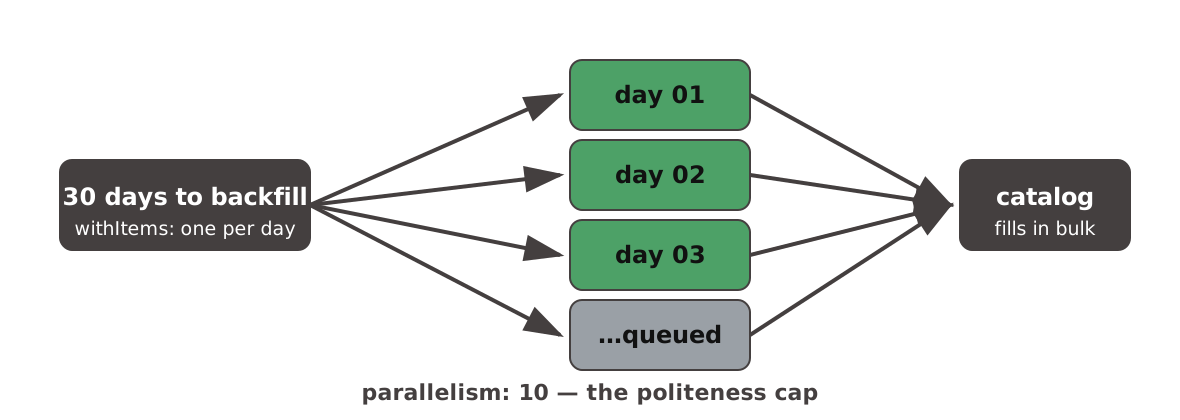
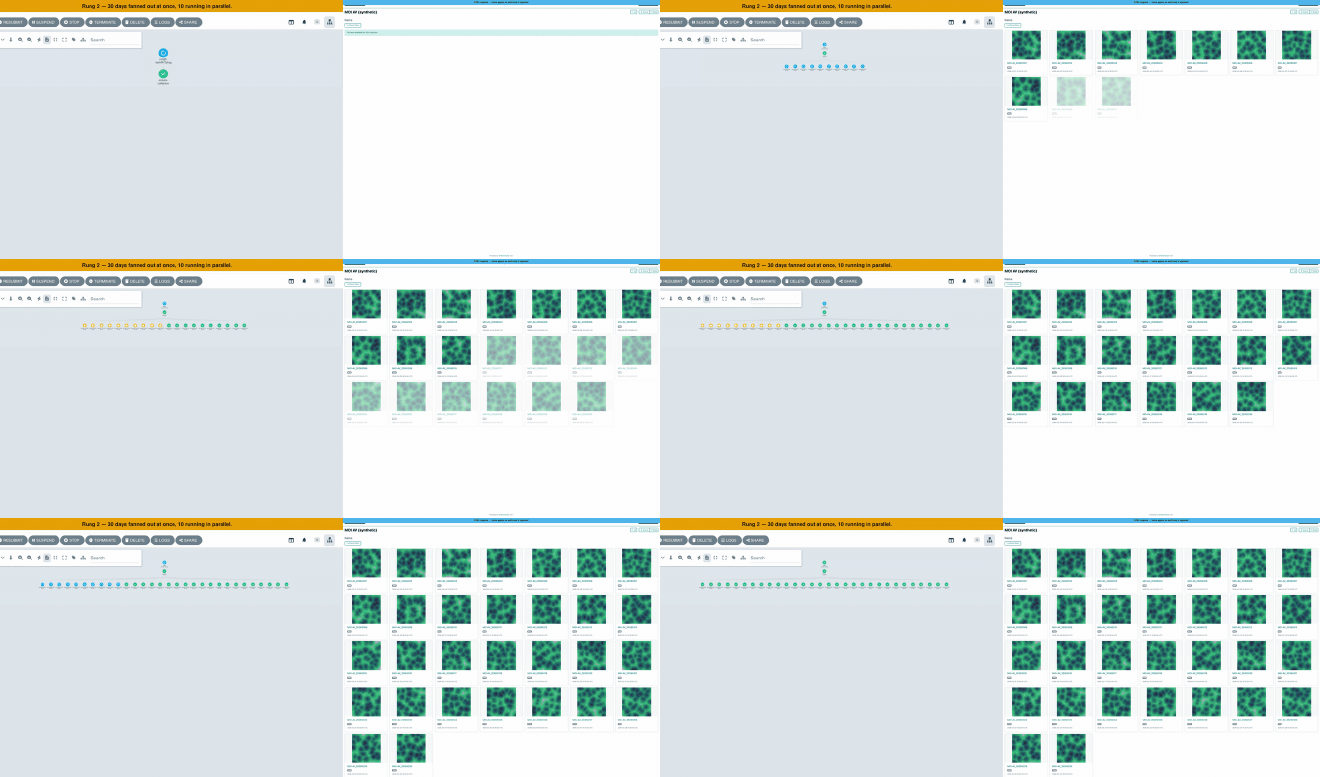
withItems is doing all the work here: you give Argo a list, and it runs the same template once per item. In the demo, it turns a 30-day backfill from 30 sequential runs into waves of up to ten pods at a time, and you can watch it happen by yourself:
make demo STAGE=02   # backfill 30 days; watch ~10 ingest pods run at a time
make browse          # afterwards — the whole month appears in the logbook at once
I was curious to measure the actual speedup on my laptop, so I ran the same workflow twice, once with the cap pinned to parallelism: 1 and once as above: about 311 seconds for the sequential version against about 50 seconds fanned out, so roughly a 6× speedup. It is not a 10× speedup because ten pods starting up on a single small kind node lose some time before any of them reach the actual work.
The parallelism: 10 line is as important as the fan-out itself: the cap should be sized to what the upstream services can absorb, not to how many cores happen to be available in the cluster.
This is also the rung I benefited from the most outside the demo. On a real pipeline, I had estimated a reprocessing job at more than 30 hours with the old monolithic approach, and it finished in less than 4 hours once I restructured it in the way I just described: one query to find what needs doing, then one worker per item. The main work for this step is to identify the part of the job that is embarrassingly parallel and to make sure no state is shared between items; the orchestrator did the rest.
Rung 3: asking the logbook what is missing #
Until now, I was always the one telling the pipeline what to do: run this day, backfill this window. Rung 3 is where the pipeline starts working out by itself what needs doing, and it is probably my favourite rung. The idea fits in a few lines:
# the idea, as I put it on a slide; the real find_gaps in src/eo_ingest/logbook.py handles the edge cases
def find_gaps(config, collection, start, end):
    present = {day(f) for f in query(collection, start, end)}   # what the logbook HAS
    return [d for d in window(start, end) if d not in present]  # what it's MISSING
The set of days that should be present, minus the set of days actually present in the catalog, gives the list of days to fetch. If we go into more details, the real find_gaps function is a bit longer than this because it has to handle edge cases (items with a null datetime, catalog pagination …), but it stays cheap: it is a single query over metadata that is already in the database, not a re-scan of a bucket or a re-download of anything.
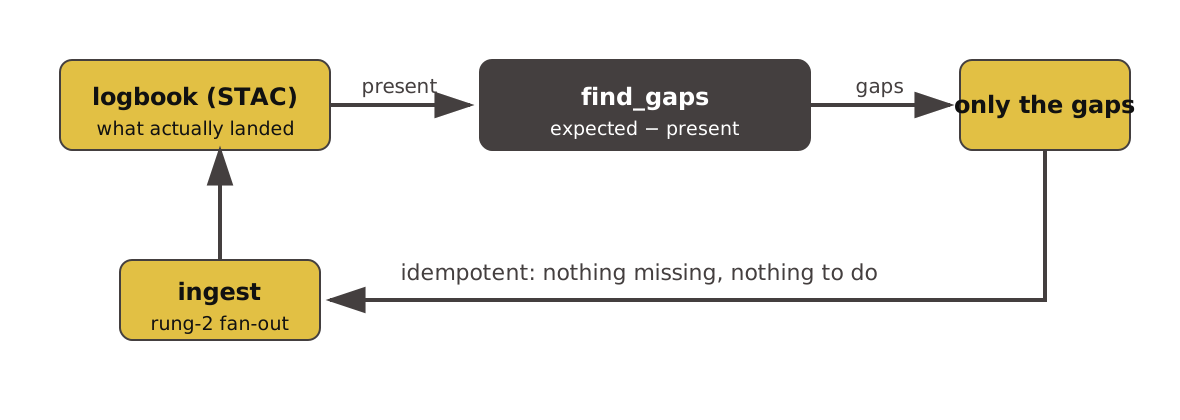
The result feeds directly into the fan-out from rung 2, with withParam replacing the hand-written list of days:
# trimmed from stages/03-stac-logbook/workflows/repair.yaml
- name: close-gaps
  template: ingest-day
  arguments:
    parameters: [{name: day, value: "{{item}}"}]
  withParam: "{{tasks.find-gaps.outputs.result}}"
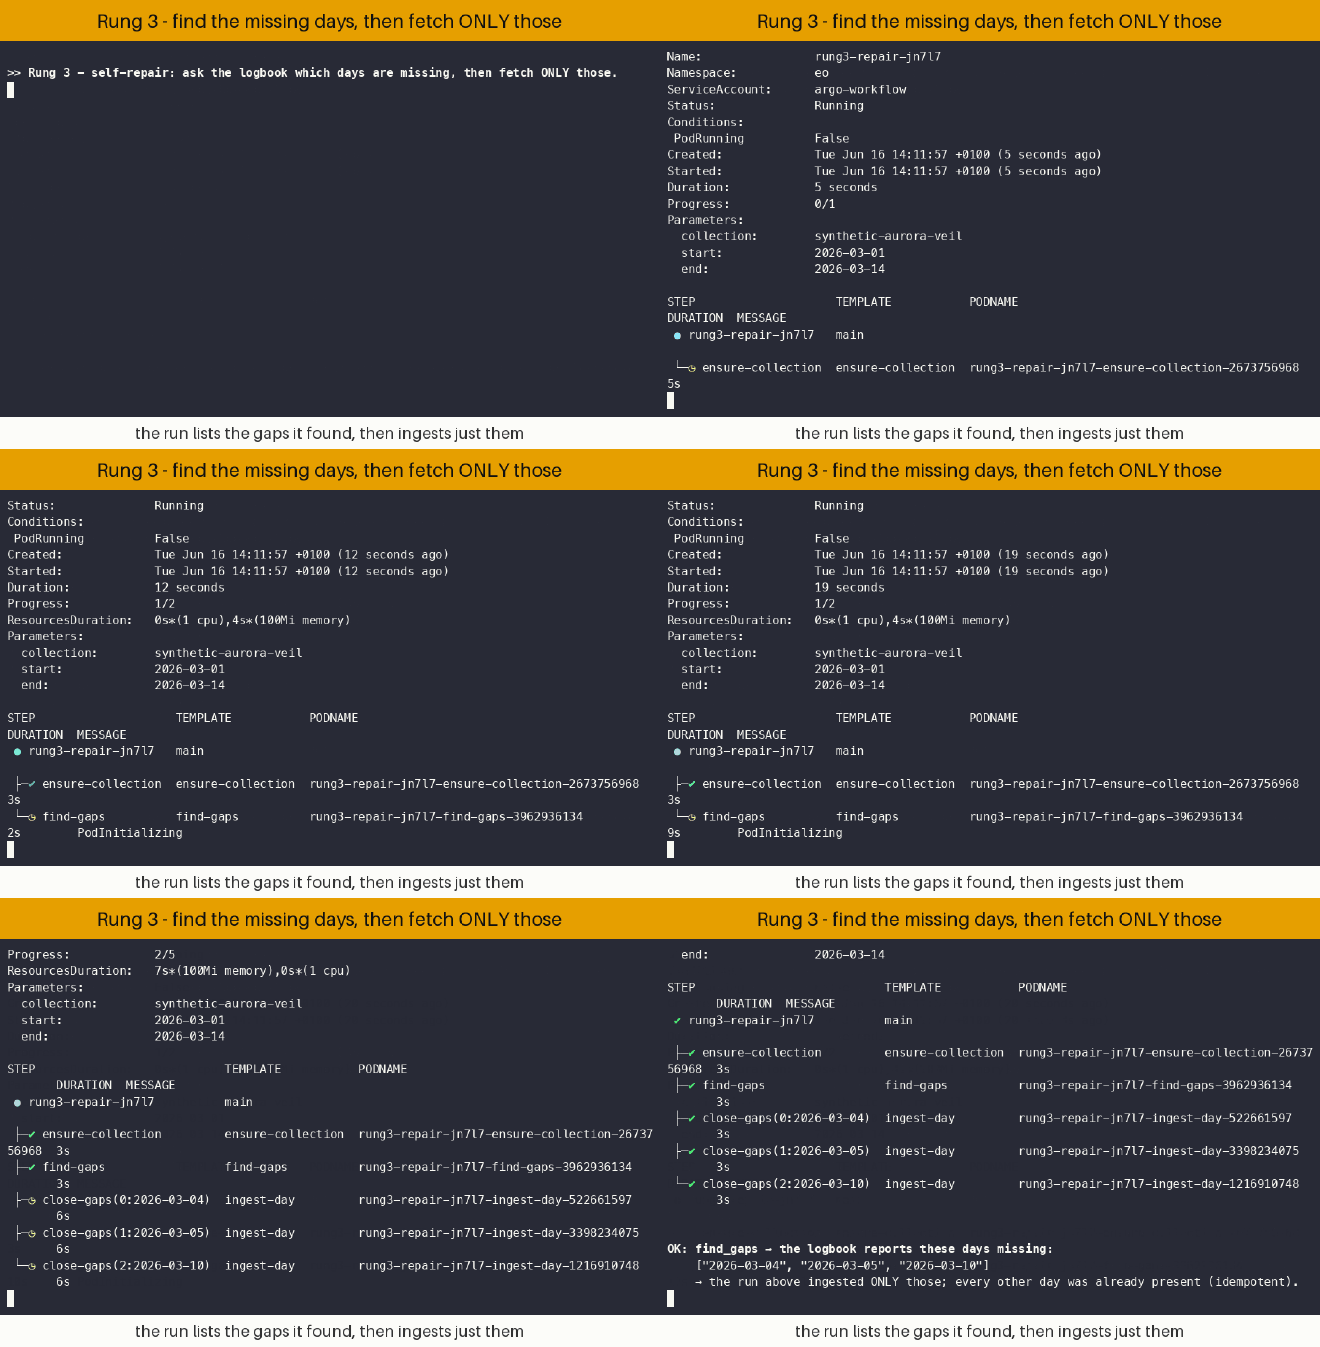
If the gap list is empty, Argo fans out over nothing and the whole workflow is a no-op. This is what makes it safe to leave on a schedule: it will not double-ingest days that are already there. In the demo you can see both behaviours back to back:
make seed            # plant two collections with deliberate, reproducible gaps
make demo STAGE=03   # find-gaps prints the missing days, close-gaps fills exactly them
make demo STAGE=03   # run it again → find-gaps prints [], zero ingest pods start
Interestingly, this rung felt very familiar to me as I was used to work on similar issues when reprocessing glider data archive during my previous life in oceanography. At that time I did not have a separate log of what had been processed, the NetCDF file naming convention was the record. If a file existed under the expected name, the day was done, and if not, it was a gap and someone (usually me) had to go and get the data. Twelve years later, here I am building the same idea again, but that time using a STAC catalog instead of a directory listing!
Rung 4: a daily report to see what happened #
By rung 3 the pipeline “repairs itself”, but I still could not easily see what it had done from one day to another, and I did not want to fall back into my old habit of checking everything by hand every morning. Rung 4 does not touch the ingest step at all; it runs the same image one more way, as a daily report:
make demo STAGE=04         # render the report in-cluster
argo logs @latest -n eo    # the gap heatmap appears in the pod logs
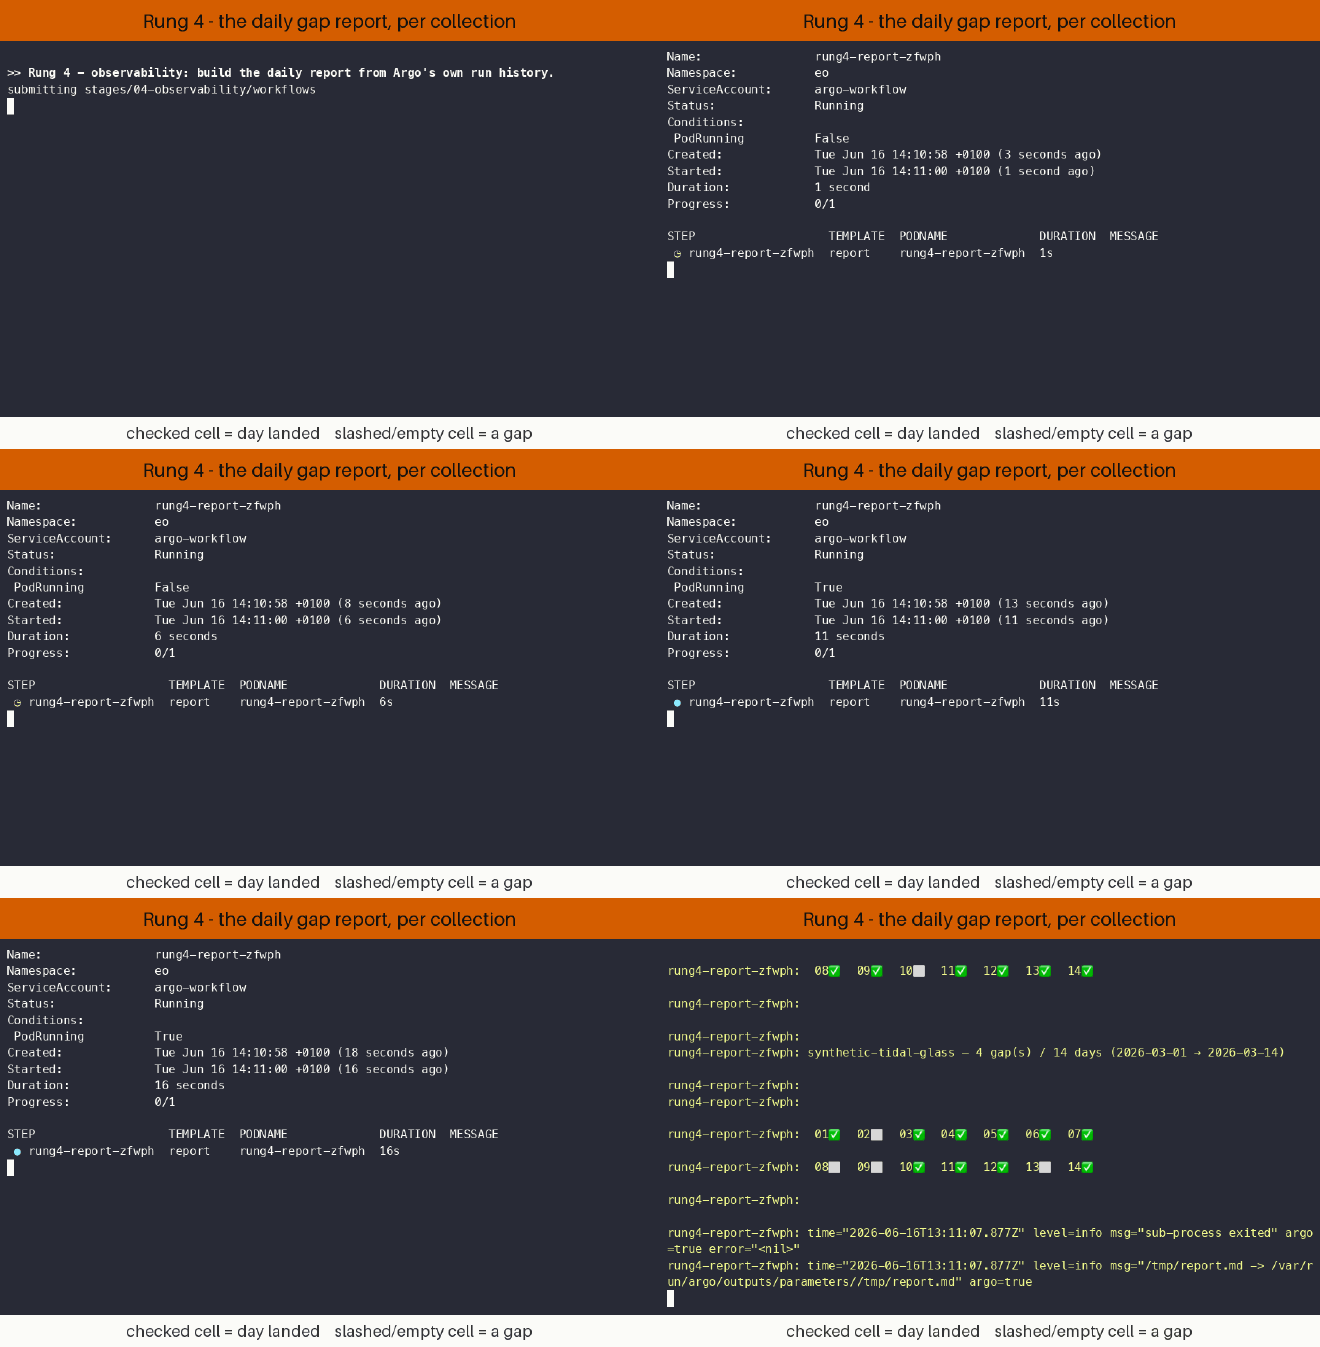
This simple demo report has two parts, matching the two kinds of repair happening underneath, and each part has its own data source:
- the item-level summary (e.g. number of failed attempts and retries) is built by querying the Argo Workflows API: the same
argo-serverthat ran the workflows keeps their run history, so the report simply asks it for the recent runs, and - the gap heatmap, one cell per day and per collection (filled when the day landed, empty when it is still missing), is built by calling the same
find_gapsfunction as rung 3 against the STAC catalog.
Nothing is exported or stored in advance for the report, no metrics files, no Prometheus or Grafana: everything is re-derived at render time from these two live sources, and the markdown ends up captured as an Argo output parameter, so it can also be retrieved from the finished workflow.

On a real multi-mission pipeline, I built the same idea with a scheduled GitHub Action instead (thank you Claude for the assistance): every morning it pulled the item metrics that the ingest pods had been writing to S3, rendered a self-contained HTML report, and opened it as a labelled GitHub issue. The prerequisites are a bit different in that case: the metrics only exist because the ingest pods were instrumented to write them to S3 in the first place, and the Action needs read read access to that bucket (plus the rights to open issues on the repo), but that is mostly all, there is still no metrics server or dashboard to keep running. One morning, this report showed 1,308 HTTP errors in 24 hours. The report did not fix anything by itself but it pointed me straight at the cause: a token-reuse bug where every parallel pod was re-authenticating from scratch instead of reusing a valid session.
Two levels of self-correction #
Looking back at this whole ladder, the ingest step never changed, only what wraps it changed. But “self-healing” actually covers two quite different mechanisms, and it may be useful to clearly separate them:
| Level | Failure | Who fixes it | Rung |
|---|---|---|---|
| Item | a single run fails transiently | Argo retries it, automatically | 1 |
| System | a whole day never lands | the logbook detects and refills it; the report surfaces it | 3 + 4 |
The item-level healing is completely automatic. If a transient failure happens, Argo retries it, and in most cases nobody even needs to know about it. The system-level healing is only half automatic: the logbook can detect and refill a missing day on its own, but it has no way to understand why the day was missing. If an upstream source has been down for a whole week, the repair workflow will happily keep retrying the same gaps every night; it takes a human reading the report to recognise the pattern and go verify what is wrong upstream.
What I’m still learning #
I am still early in my Argo Workflows journey, and there is plenty I don’t fully grasp yet! To give a few examples:
- I have been stuck more than once because of semaphores… For example, I have already had to clear “phantom” semaphore holders (ghost locks that block queued workflows, with nothing visible in the Argo UI 😢) without really understanding the controller internals that create them.
- Capacity planning is another one: in rung 2 the
parallelismcap is there to protect the upstream services, but on a real production cluster there is a second limit, the cluster itself. If you launch enough workflows in parallel, the nodes run out of CPU and memory, pods pile up inPending, and workflows start queueing behind each other. I am still learning how to estimate what a cluster can absorb before launching the work, rather than discovering it when things get stuck… - I have also only just started with event-driven triggering (Argo Events) as an alternative to a cron schedule. My first sensor is deployed, but I am still very much at the “copy and adapt” stage.
I am very thankful to my colleagues who patiently answered all the questions I had when I started working with Argo Workflows and Kubernetes (a very big thank you Emmanuel and Ciaran!). They really helped me become comfortable with this new tech stack, work more and more independently, and deepen my knowledge much faster than if I had been learning on my own.
After my FOSS4G presentation, I also had very interesting discussions on Temporal, a workflow engine I had never used before. It gave me ideas for small projects I could build to understand how it compares with Argo Workflows, and assess what additional values Temporal could bring to our projects.
Wrapping up #
I wrote this post mostly to write down and share the main things I learnt during my first year working on Earth Observation data pipelines as a cloud engineer, but also to show that, with the right architecture and tools, making a data pipeline more reliable is not that difficult, even when you are new to the tools, like I was.
I find that writing things down also has a lot of value on its own! It is one of the fastest ways I know to find out which parts I only half understood (it happened more than once while writing this post 😅), and, as I experienced at FOSS4G, sharing what you learnt is a great way to start conversations that would never have happened otherwise!
Everything I presented here is available in the companion repo argo-stac-eo-pipeline: make check; make up brings the whole demo up on a laptop, and you can then walk the rungs one by one with the commands I gave along the way. The full guided tour, with what to expect at each step, is in docs/walkthrough.md, and the slides of the talk are at lhoupert.fr/foss4g2026-talk.
The same patterns run in production for the EOPF Explorer project, a service available through the Copernicus Data Space Ecosystem.
This post is based on the talk “From Cron Job to Self-Healing Pipeline” I gave at FOSS4G Europe 2026 in Timișoara. It was my first FOSS4G and it was really a great experience, and it definitely makes me want to go to more FOSS4Gs (I already submitted an abstract for FOSS4G-UK happening in October 2026 😅)!